
4P categorization for comparison tables
See what your brand really stands for across product, price, place, and promotion, and where it wins or has to work harder.
1. What does it do?
4P Brand Tracking measures what people link your brand with across the four Ps and tells you what to do on every need.
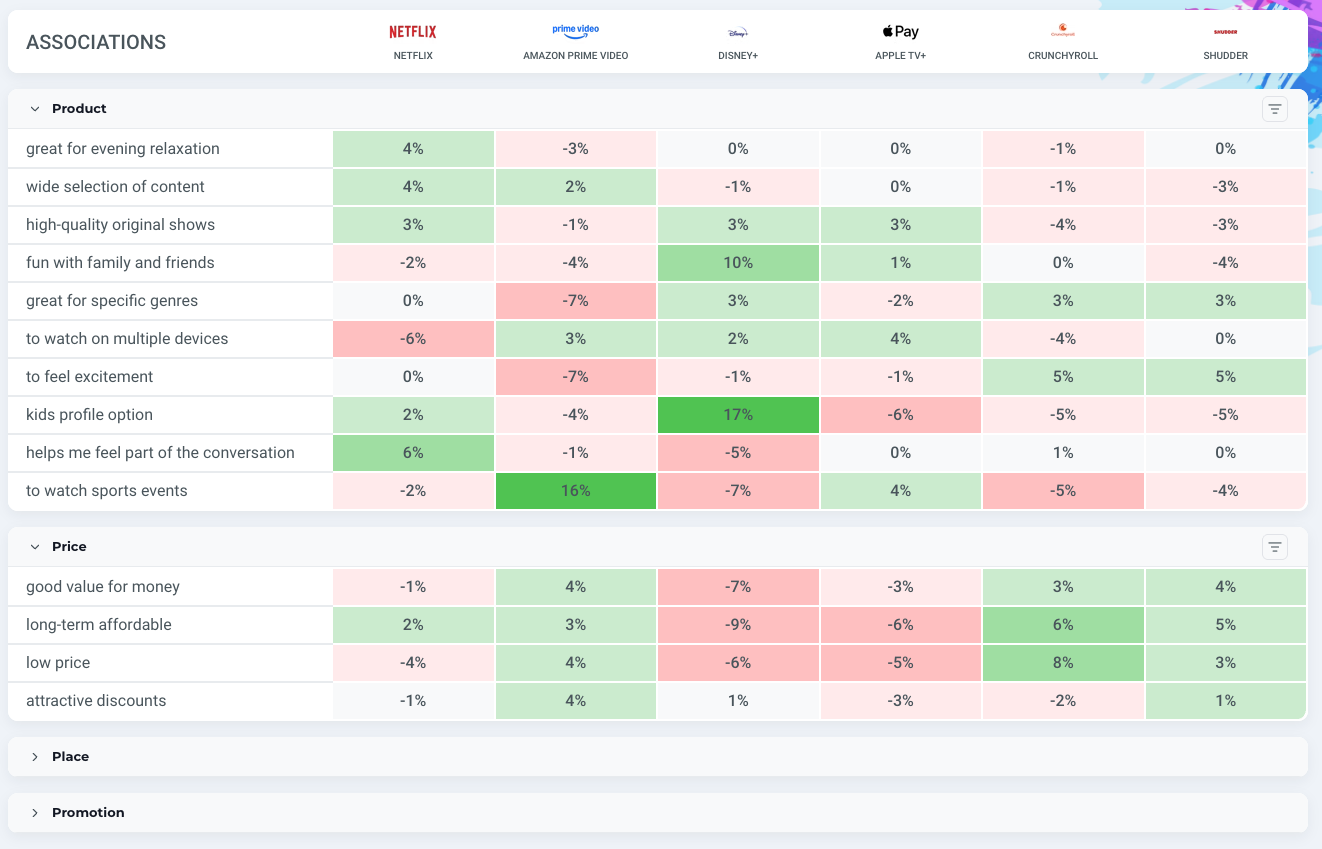
The comparison tables now group your associations into these four categories:
- Product: what your brand offers and the needs it meets, for example "wide selection of content" or "great for evening relaxation."
- Price: how people perceive your value, for example "good value for money" or "attractive discounts."
- Place: how easy your brand is to find and access, for example "easy to buy online" or "pre-installed TV app."
- Promotion: how your brand shows up in communication, for example "unique brand elements" or "standout advertising."
Instead of one long list, you get a clear picture of which parts of your marketing mix drive your brand, and which ones hold it back.
2. How to read it
Each category appears as its own section in the comparison table, with your brand and your competitors side by side.
- Click the arrow next to a category name to expand or collapse it.
- Read across a row to see how strongly each brand is linked with that association.
- Compare categories to spot patterns. Your brand might lead on Product but trail on Price, which tells you exactly where to focus next.
The 4P categories work across all three comparison views, which you can switch between using the dropdown menu – the trend view, benchmark view and differentiation view.