
Notes, Targets and Spends
Enrich your research with context that matters for reading the results.
On the Timeline view — Key Metrics and Associations — you can layer in your own notes, targets, and spends to explain shifts and track progress against your goals.
1. What can you add?
Three types of data:
- Notes — Mark key moments like campaign launches, milestones, or market events that help explain why a metric moved.
- Spends — Record your media investment for each wave and view it right next to the actual effect on your brand.
- Targets — Plot your internal goals directly alongside actual performance, so you can see at a glance whether you're on track.
They appear right inside the chart, giving you the full story behind the numbers.
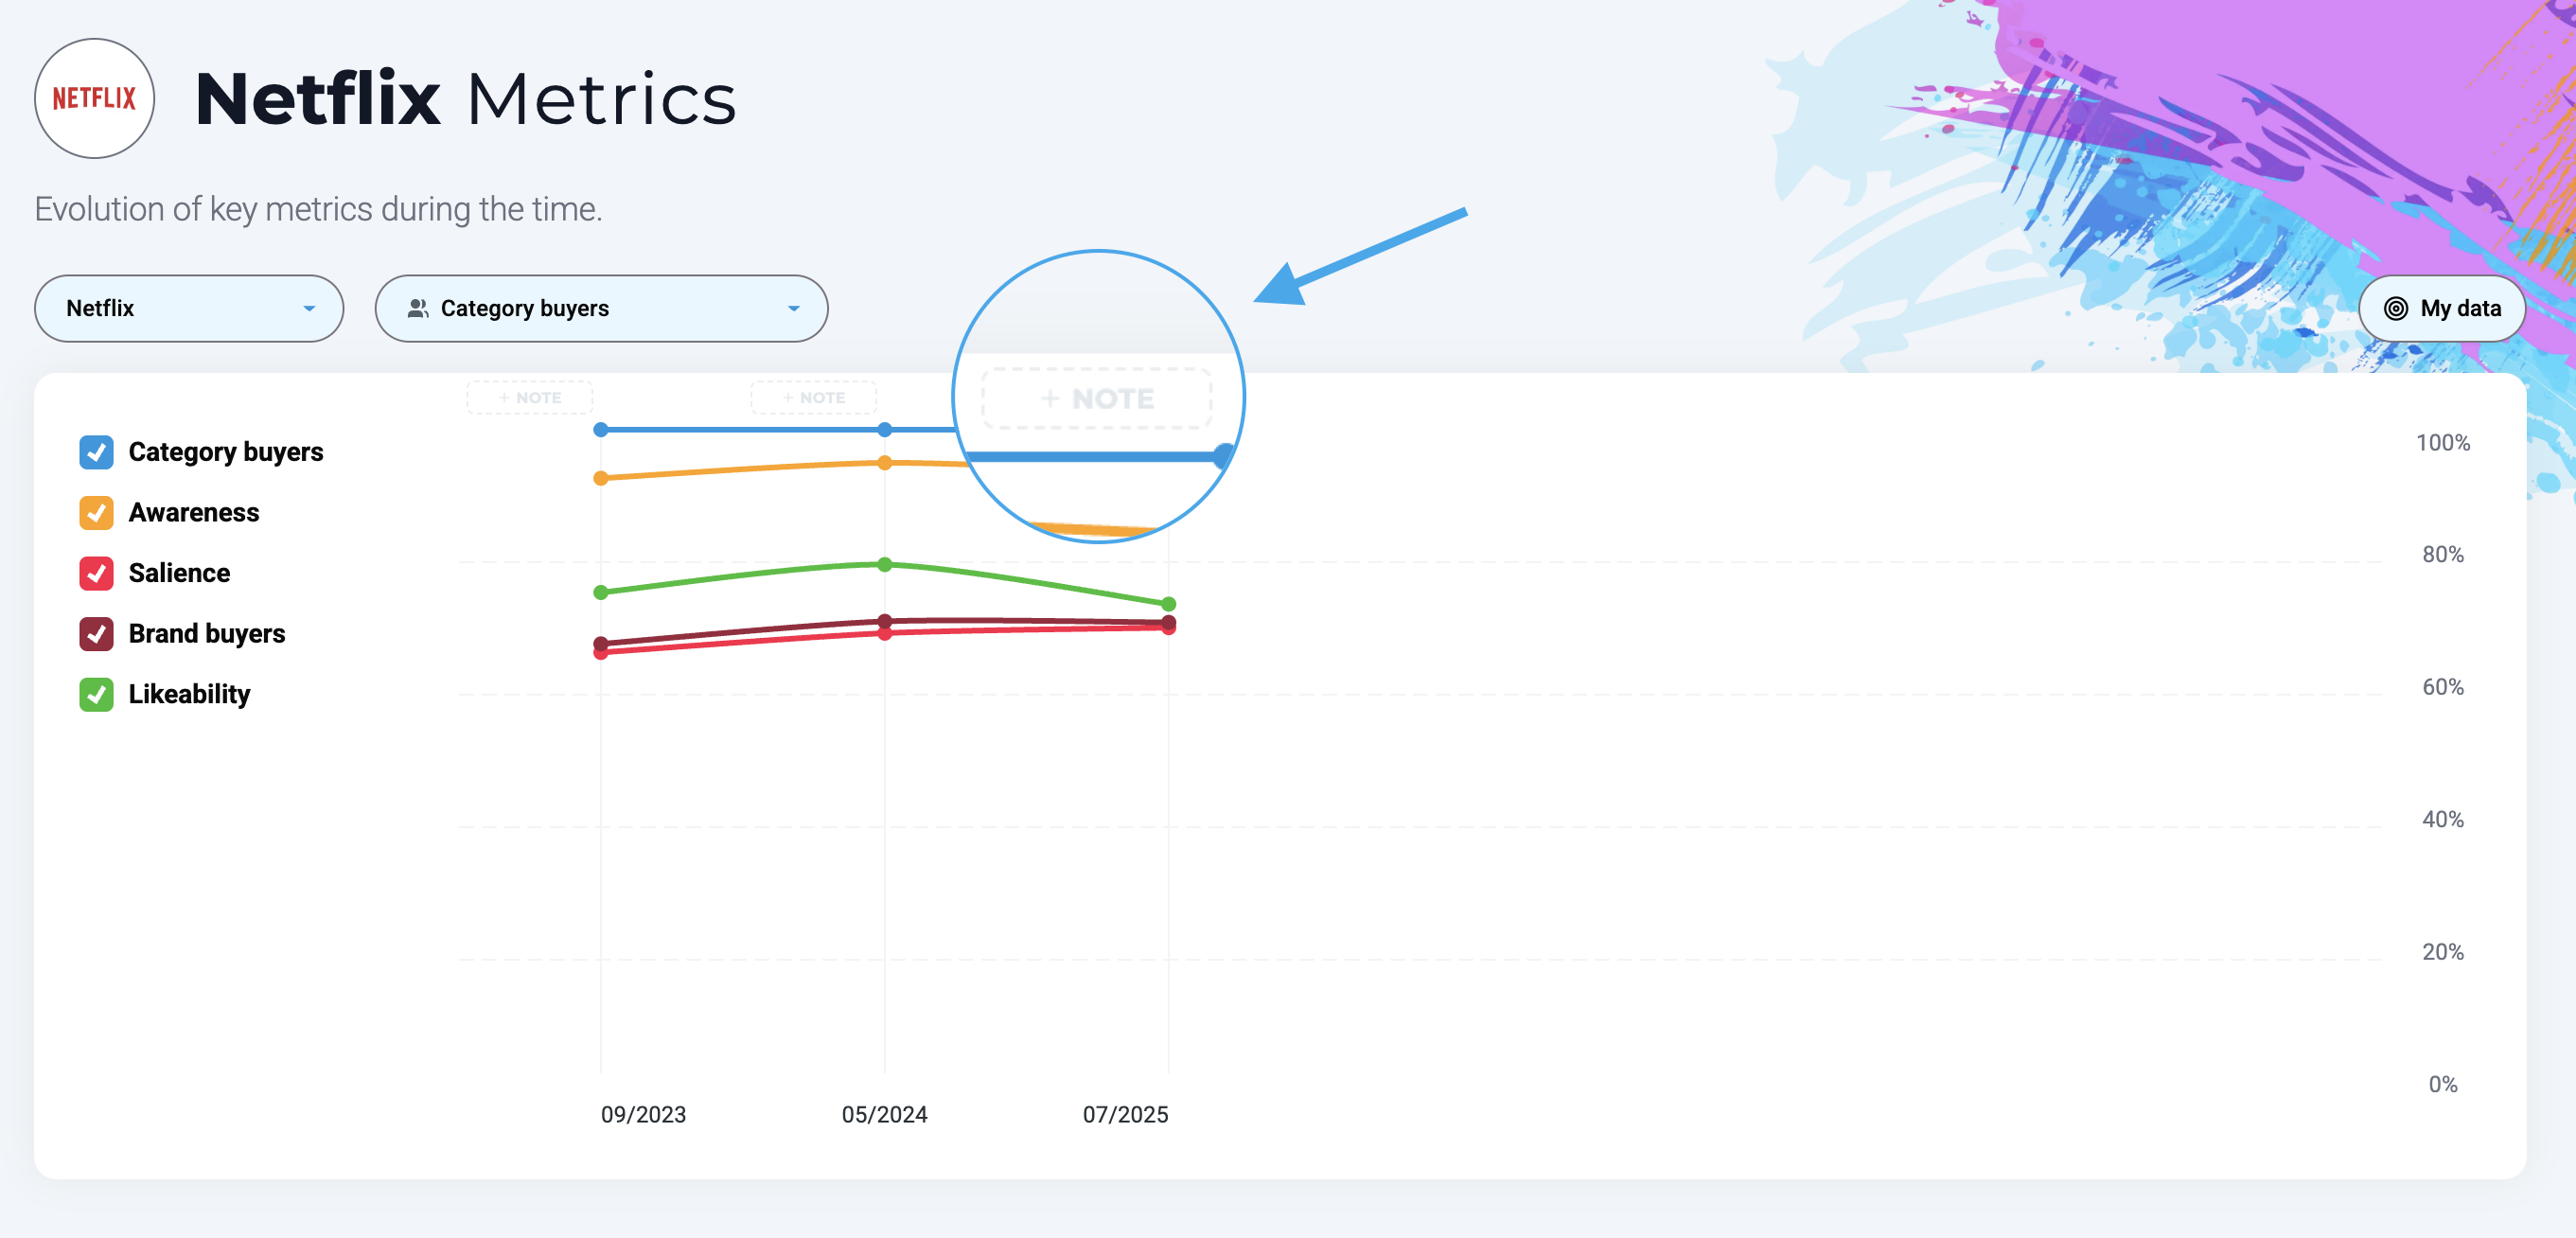
2. How to add Notes
- In the chart at the top, you'll find a + Note box above each wave.
- Click the box and type your note — up to 150 characters.
- To edit a note later, click back into the box. To remove it, click the trash icon.
3. How to add Targets
- Click the Spends & Targets button in the top right of the chart.
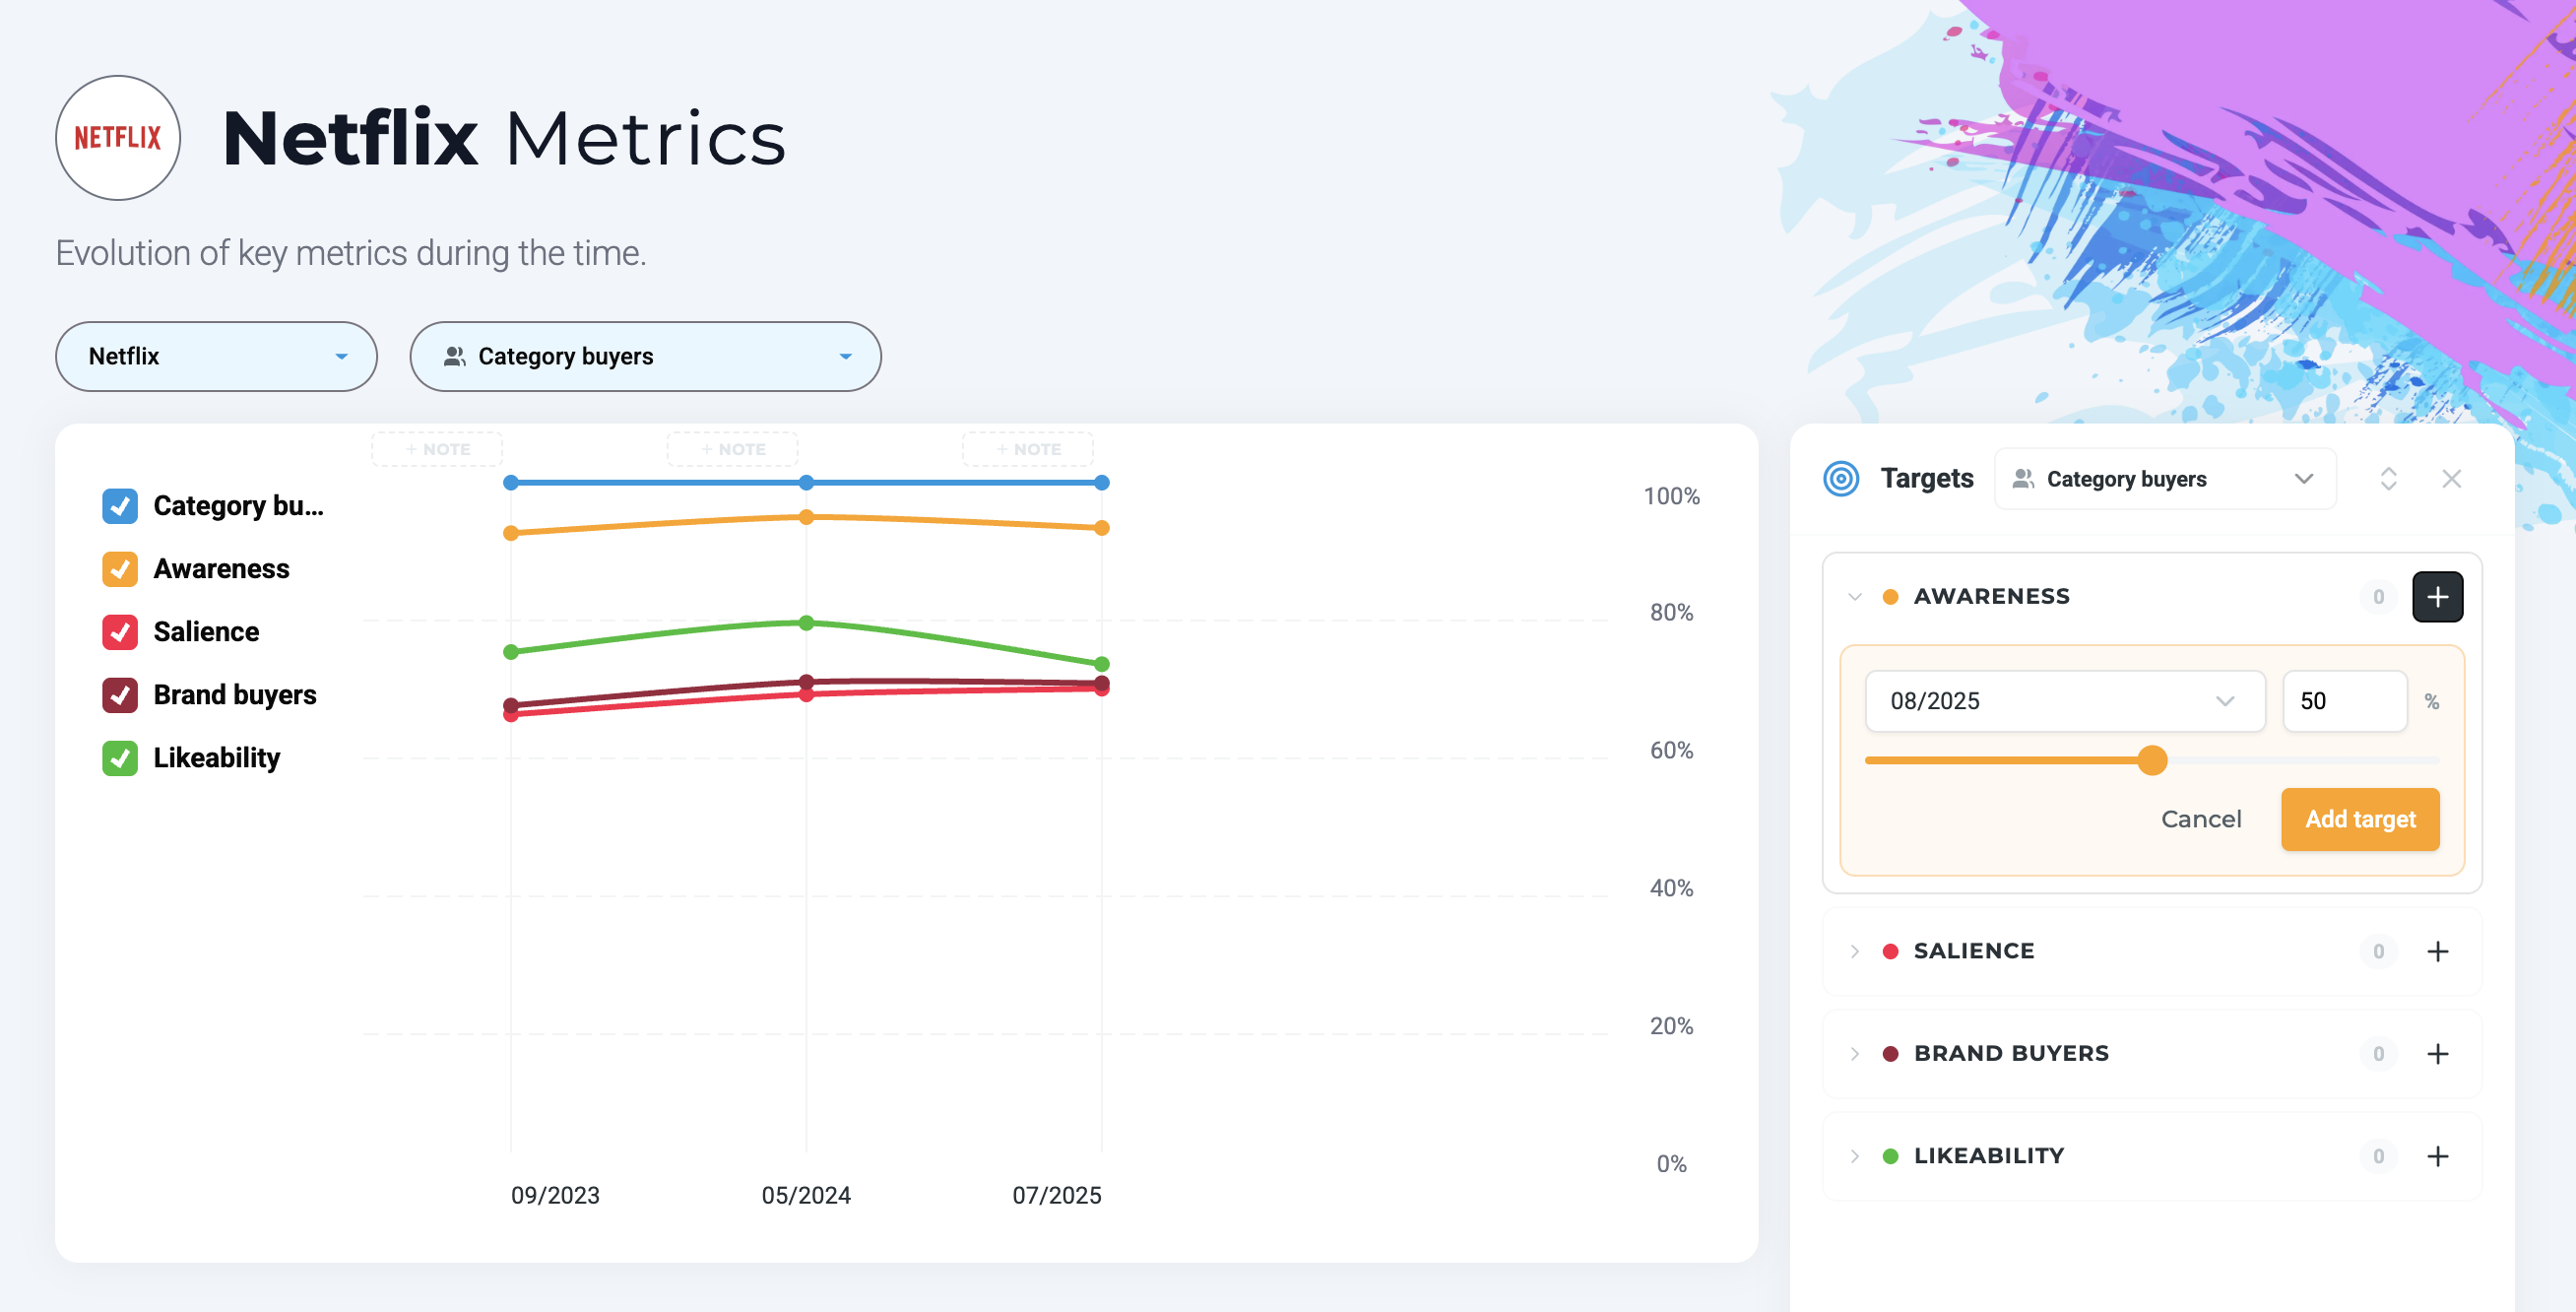
- Select Targets, pick a segment, then click the plus icon next to the metric you want to set a target for, and enter your desired value.
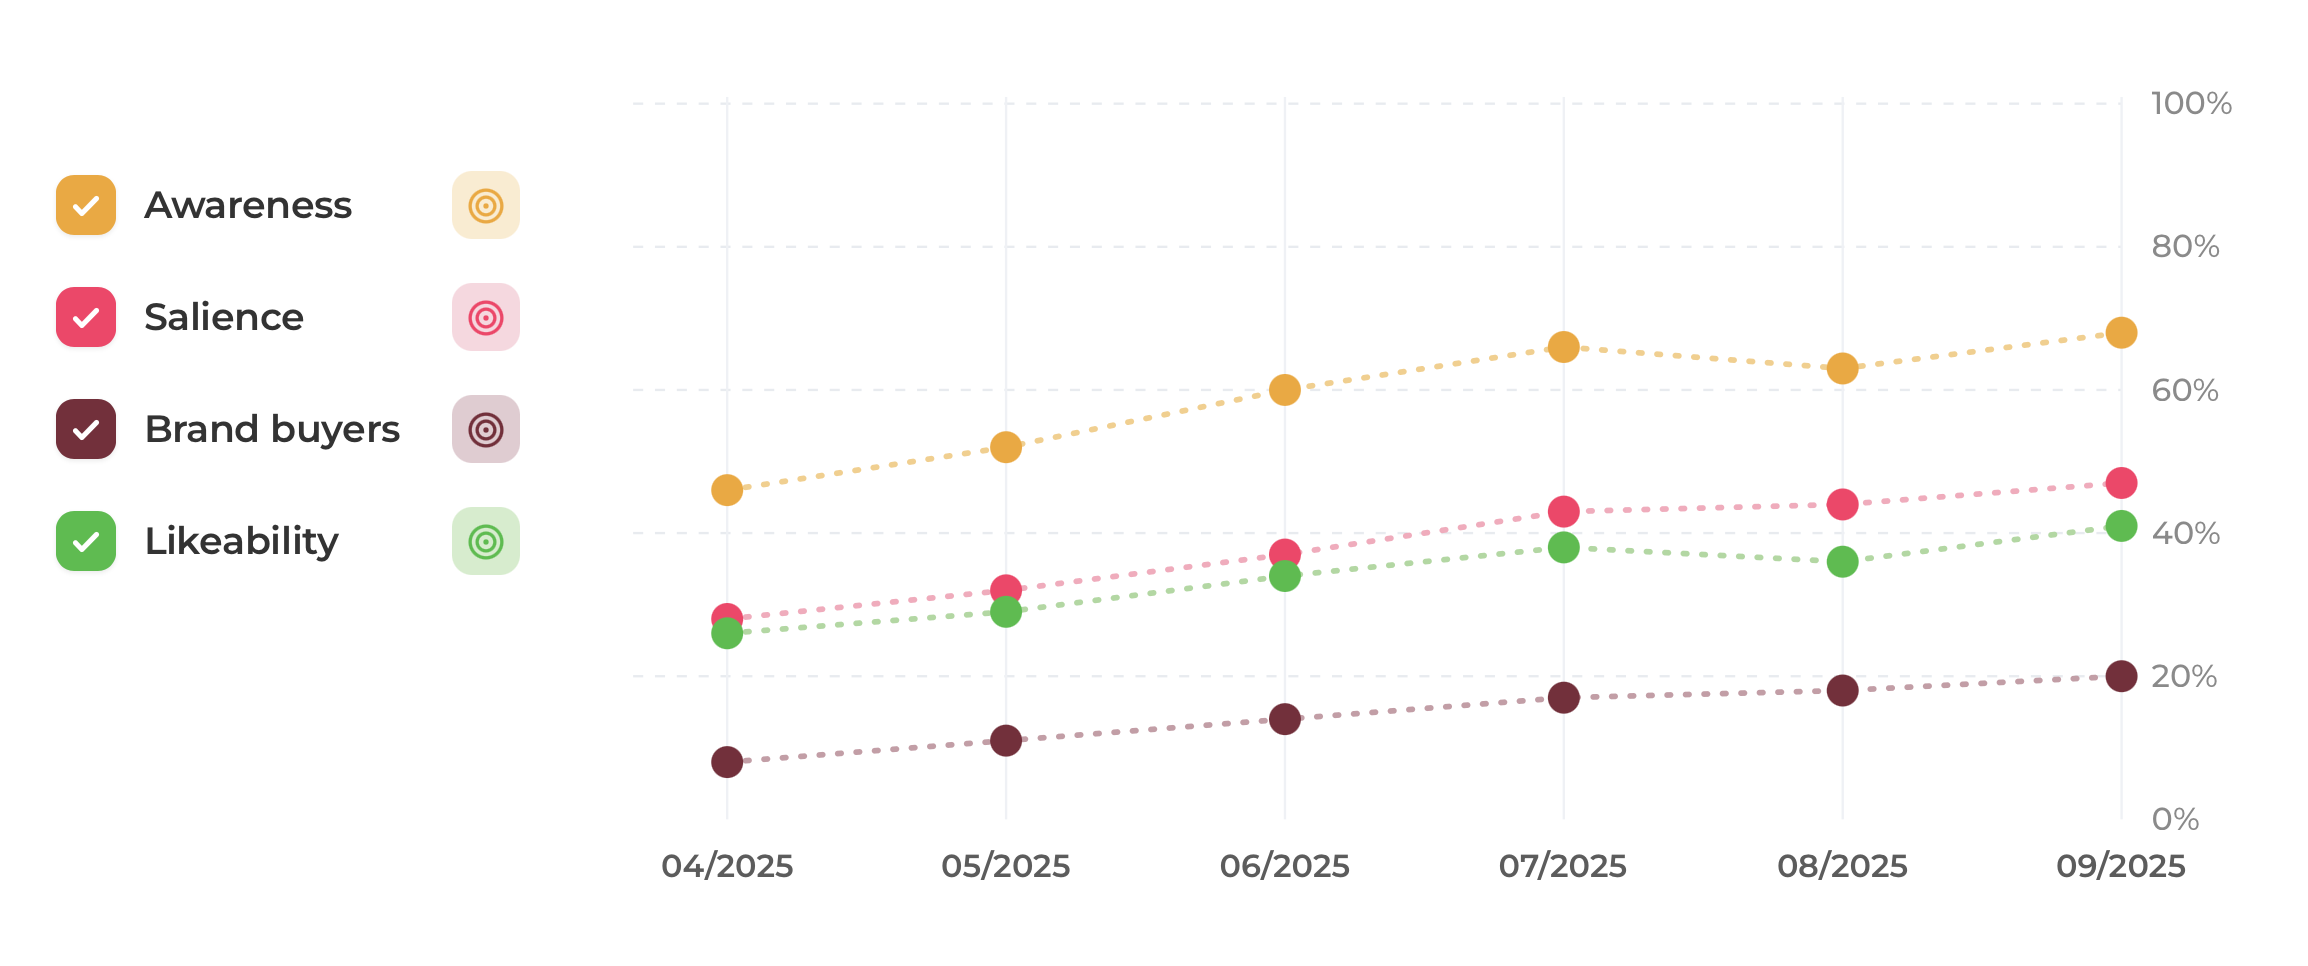
- You can add multiple targets for a single metric. They'll appear in the chart as a dashed line, so you can track your trajectory over time.
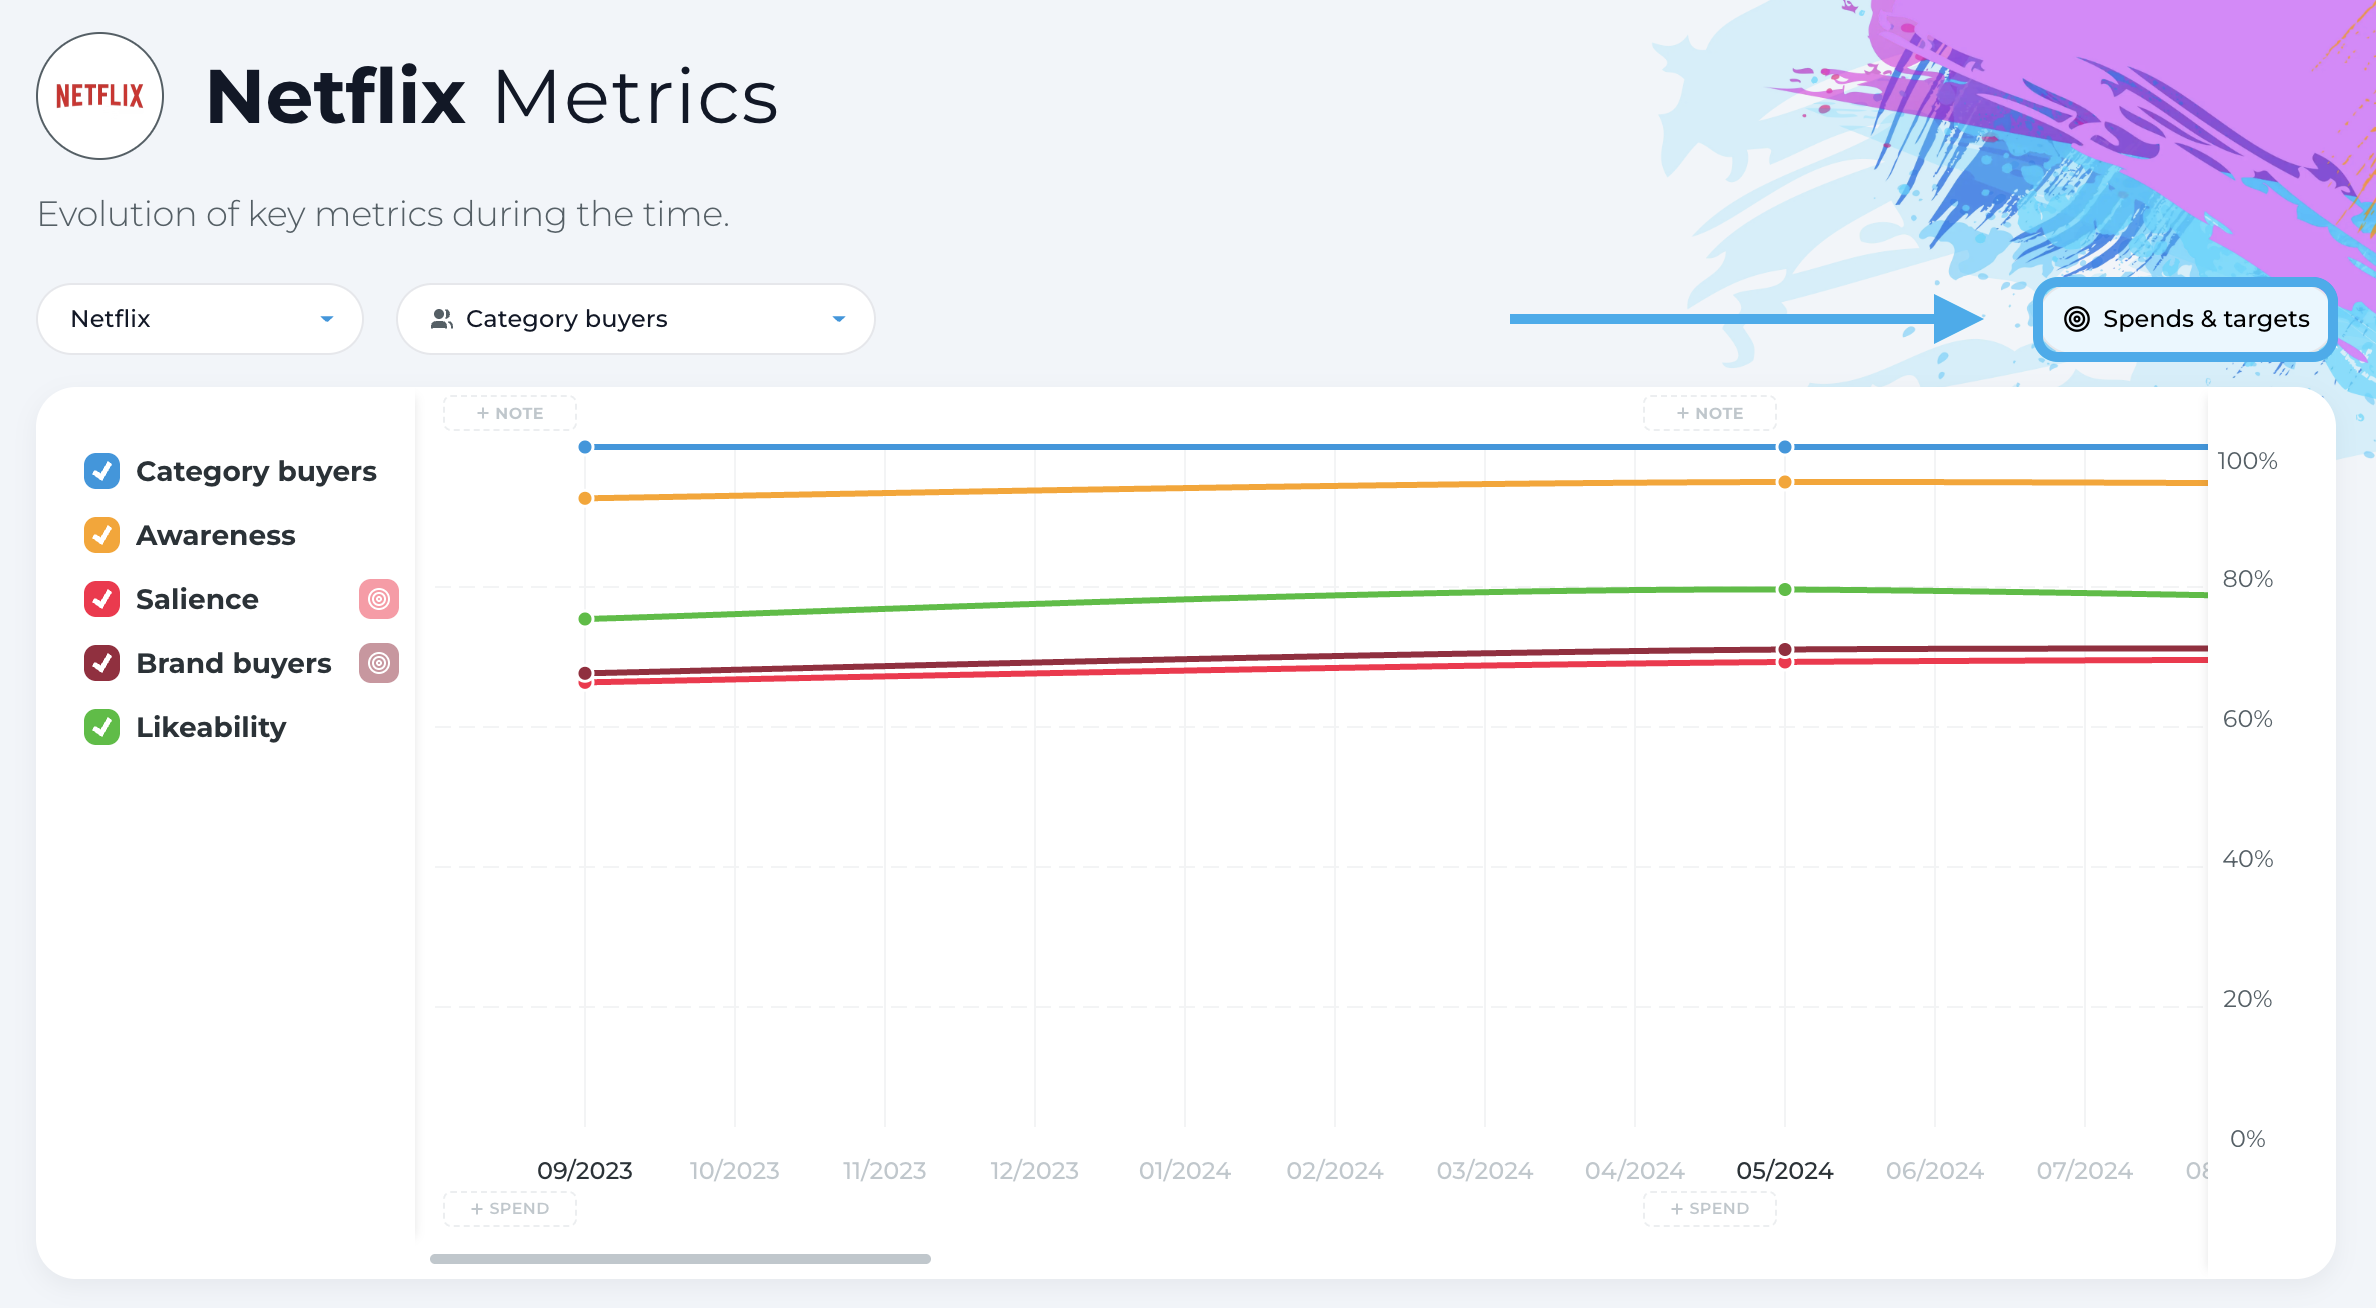
4. How to add Spends
There are two ways to add your media investment:
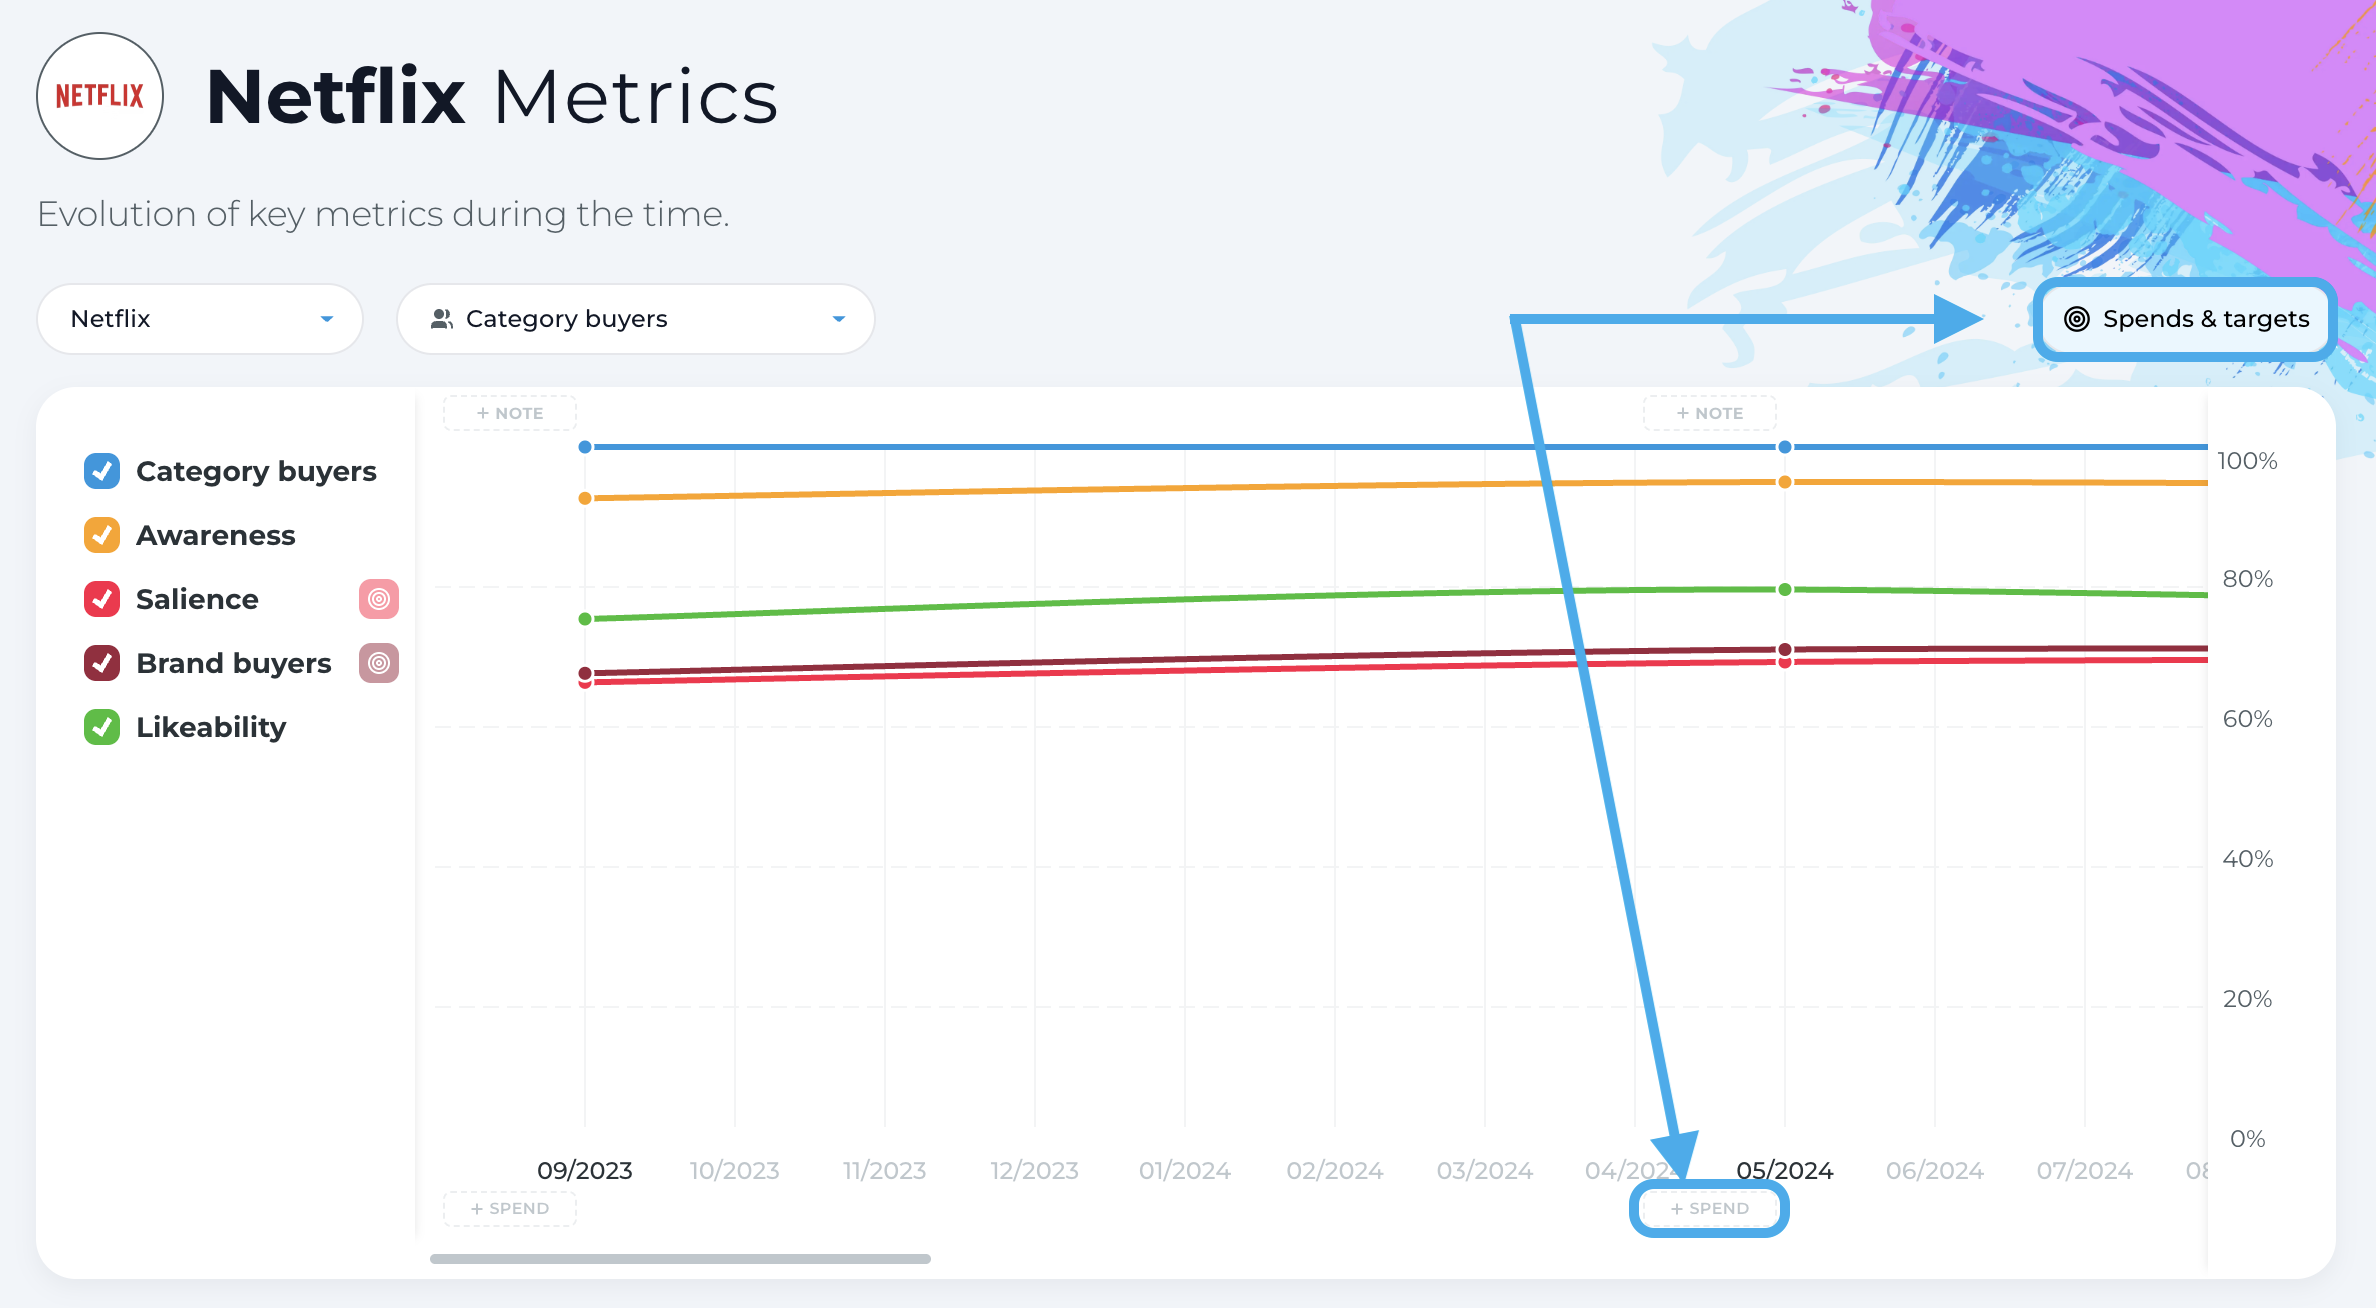
- Click the + Spend button at the bottom of the chart, under the wave you want to add spend for.
- Or click the Spends & Targets button in the top right and add your spend there.
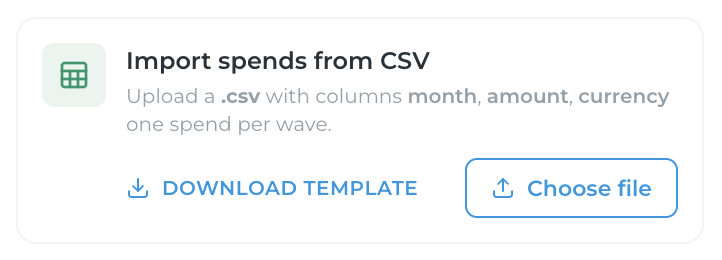
Enter your investment for each wave, or upload a file you already have. ⬇️ The system will read the data in for you.
✅ That's it.
Your Notes, Targets and Spends are now live in the report, ready to give you the context behind every shift.