
Attention Heatmaps
1. What do heatmaps show?
Attention heatmaps visualize how people’s eyes move across your video or static ad. They reveal what grabs attention and what parts go unnoticed.
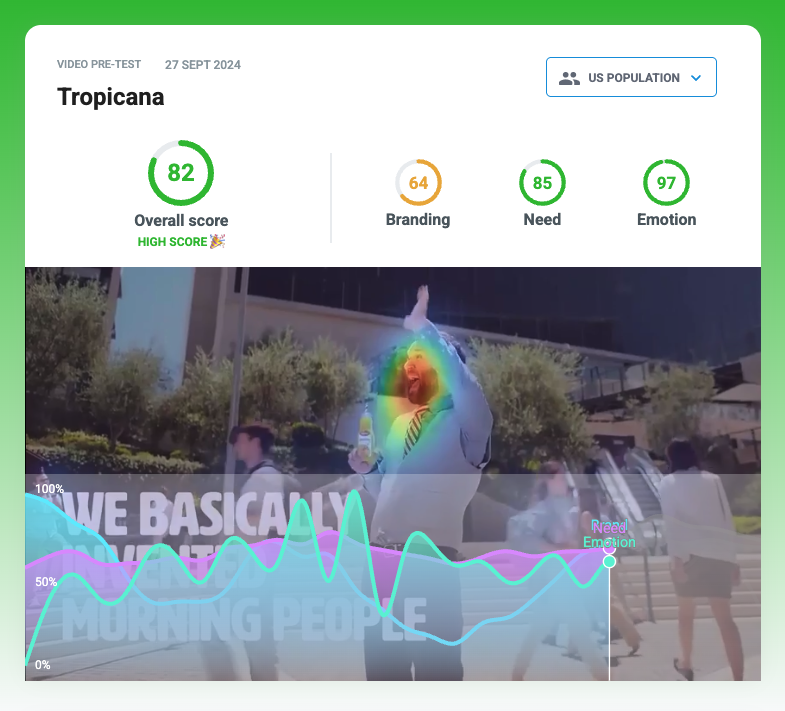
Preview example (desktop recommended)
Check out a sample of a Tropicana campaign test with a heatmap on our platform (make sure you're on desktop - we’ve got so much data, it won’t fit on a small screen).
How heatmaps help:
- See whether your branding appears in high-attention zones.
- Understand which elements attract viewers the most.
- Find emotional hotspots to guide stronger storytelling.
2. How do heatmaps work?
Our heatmaps are powered by the UNISAL model, developed by researchers at the University of Oxford.
Built on Google’s MobileNetV2 visual architecture, it’s trained on 20,000+ eye-tracking experiments to accurately predict what captures attention in both static and moving images.
This means you get:
- Scientifically validated predictions of where attention goes.
- Reliable, actionable insights to optimize creative design.
- Results available for both video and static visuals.
3. How to submit your creative
We’ll need just a few things to generate your heatmap:
- Upload your creative (video or static visual) to this form.
- You’ll receive your attention heatmap in as little as 24 hours.
4. What do the results look like?
You’ll see:
- Attention visualization – which areas people focus on most.
- Brand power – whether your logo or key visuals land in high-attention zones.
- Boosted impact – how to reposition or simplify visuals to increase effectiveness.
Each heatmap includes color intensity layers:
- 🔴 Red – highest attention
- 🟠 Orange – medium attention
- 🟢 Green – lower attention
Everything ready! What now?
Upload your ad creative directly here, and we’ll make sure nothing is missing and start analyzing attention data immediately.
And the best part — the heatmap test is completely free.
No strings attached. Just upload your creative and see what captures your audience’s attention.