
Attention Share
Attention share reveals how a viewer's focus is distributed across an image, highlighting what truly captures attention and what goes unnoticed. This insight helps determine if key elements, like a brand's assets, effectively draw the eye. How the Attention Tool Works
- Display attention heatmap.
- Active Measuring Mode.
- Draw rectangles over any areas of the image you wish to analyze. You can add as many as needed.
- View the attention share for each rectangle as a percentage—higher percentages mean more visual focus.
- Edit the areas: you can move, adjust, or delete rectangles individually or all at once.
- Always select a rectangle first before performing actions like moving, deleting, or adjusting.
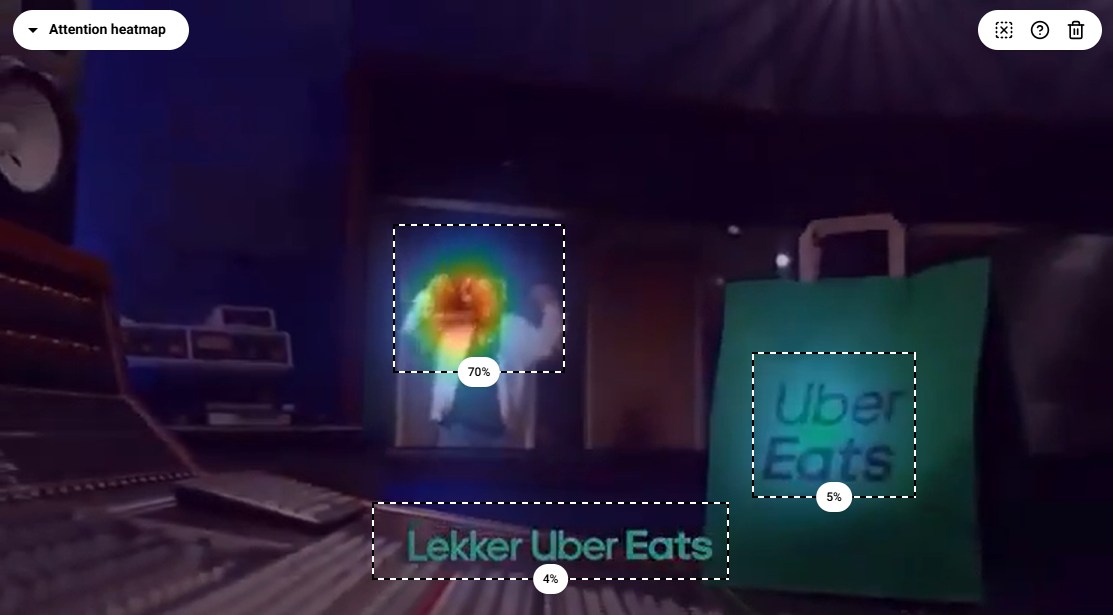
Example: Evaluating Attention Share of Brand Assets - Rectangle 1 over the main spot → 70% attention - Rectangle 2 over the Uber Eats logo → 5% attention - Rectangle 3 over an Uber Eats message → 4% attention
Use attention share analysis before launching a tour or campaign to ensure users notice what matters most.